What is a Candlestick Chart?
The Short Explanation:
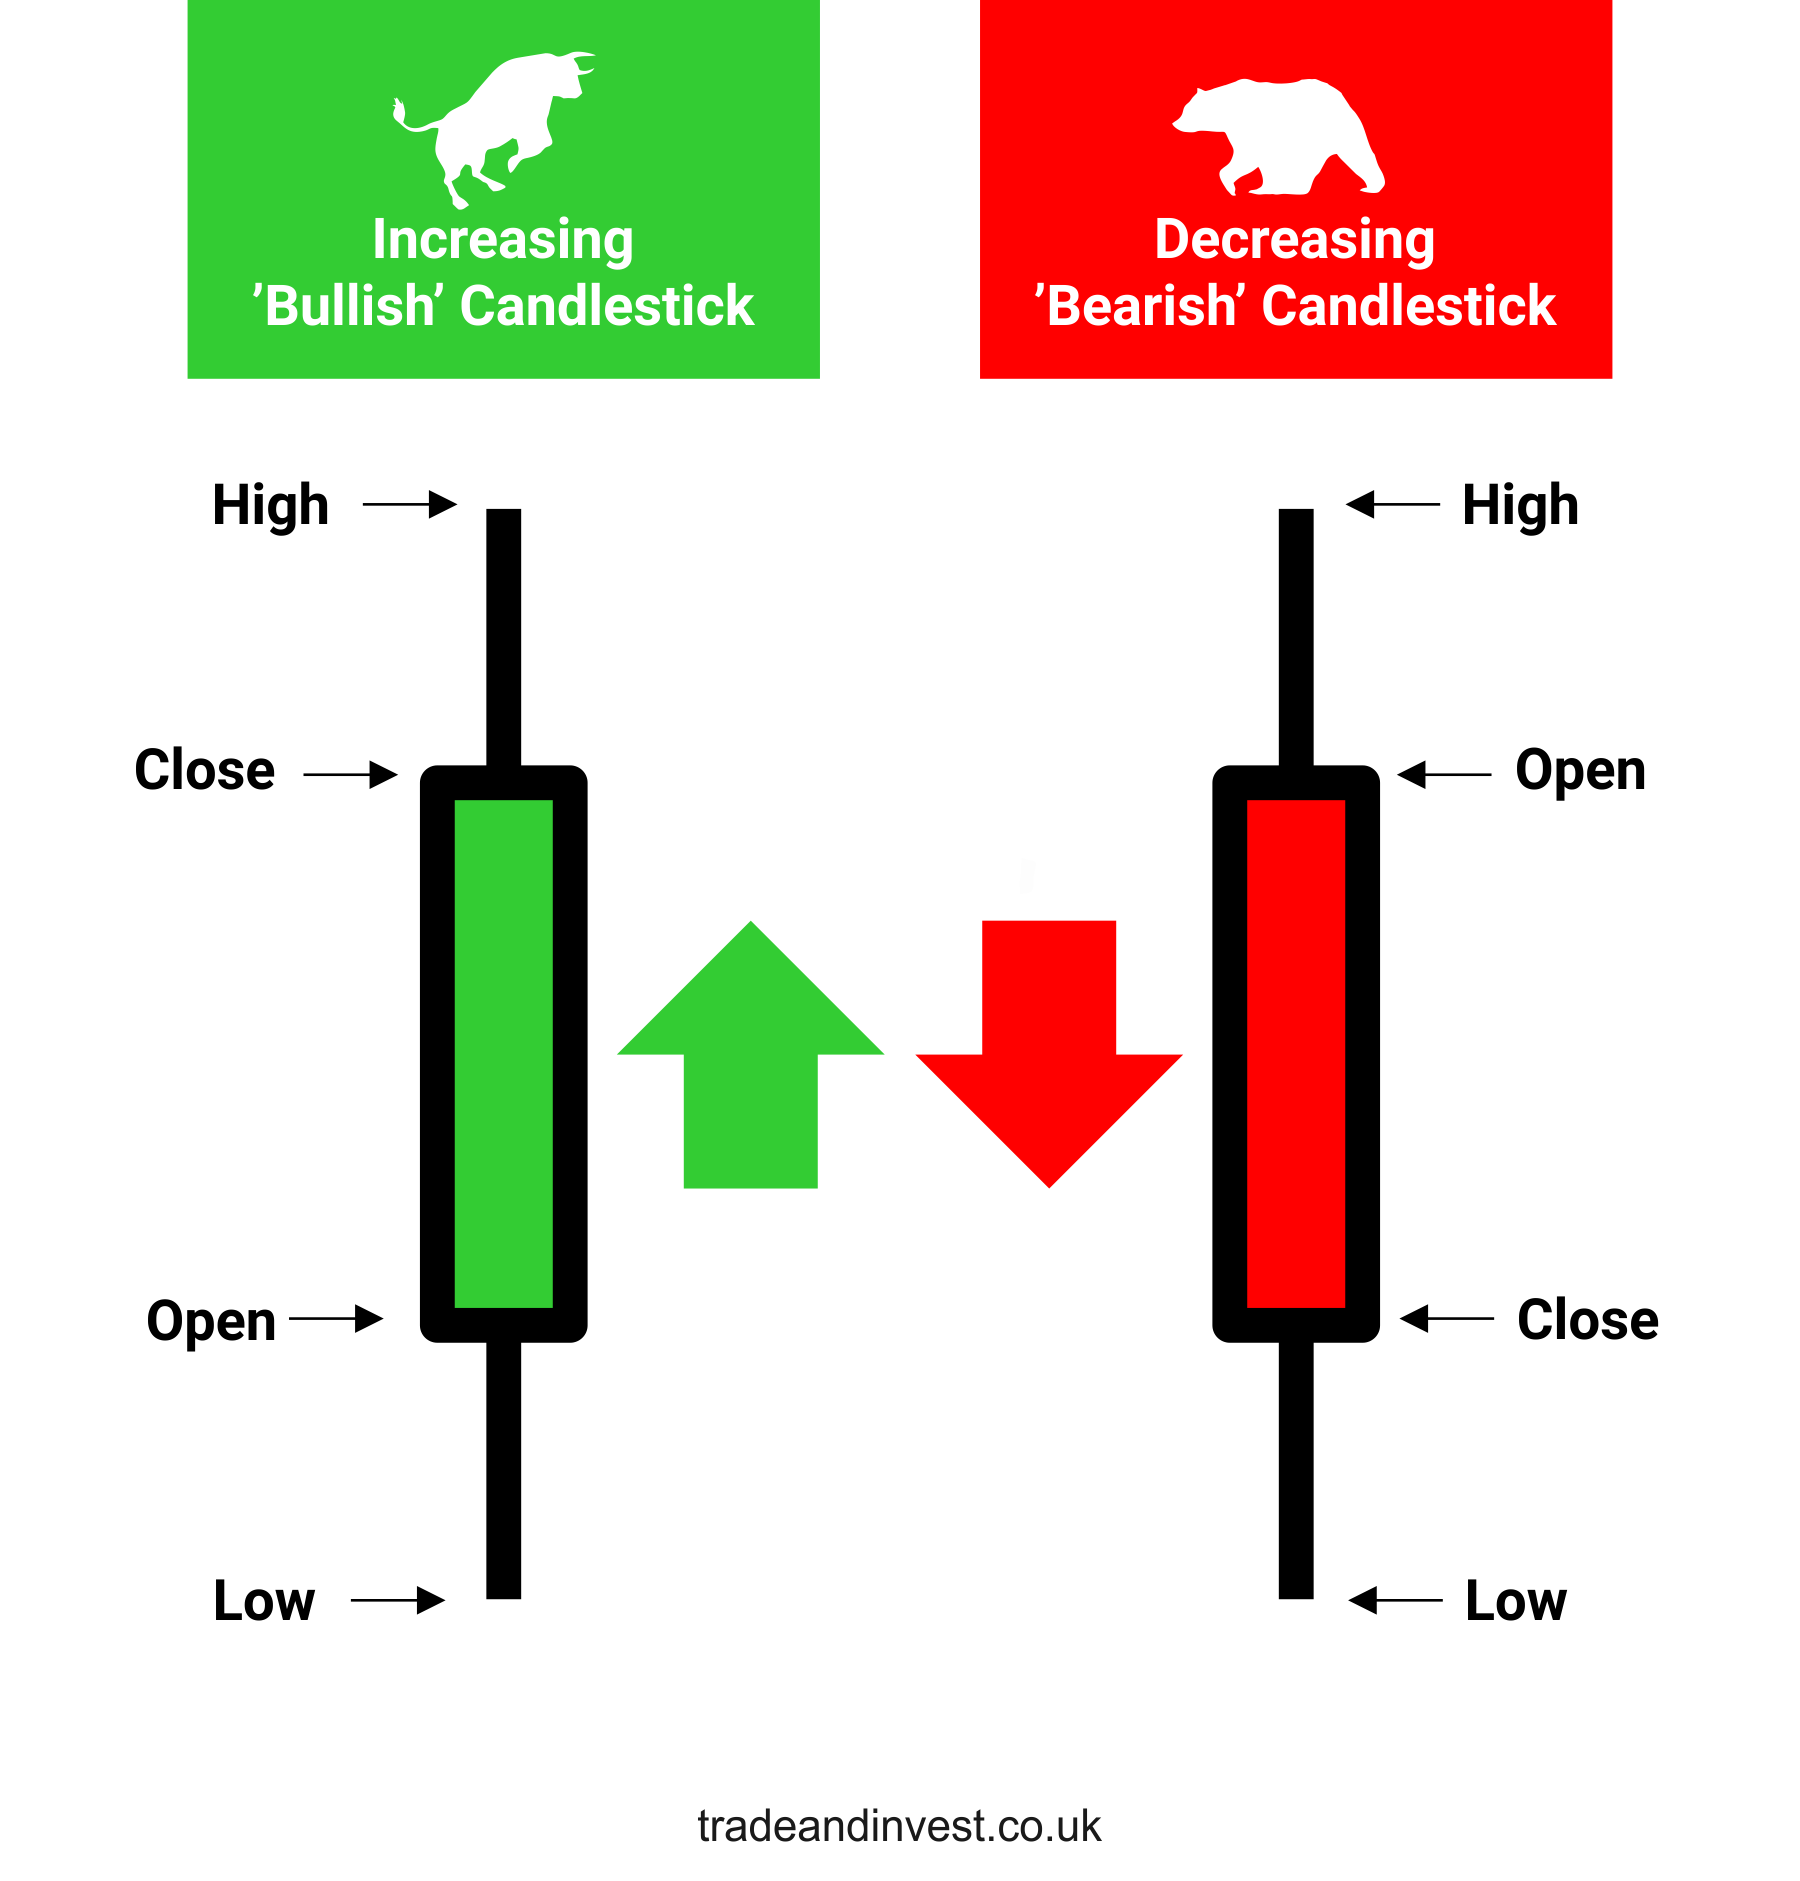
Candlesticks are a useful visualisation of the price movements of a security, derivative, or currency. Candlesticks visualise four price points: Open, close, high, and low. Typically a candlestick shows the four price points of a single day.
Candlesticks can be used to predict short-term price movements. Therefore learning about different types of candlestick patterns that repeat themselves can give a trader an advantage. Candlesticks are therefore be extremely helpful when conducting Technical Analysis.